
Contents
Coursera Professional Certificate – IBM Data Analytics with Excel
➔
★★★★★ 4.7 / 5
The IBM Data Analytics with Excel and R Professional Certificate on Coursera is a thorough and accessible program designed to fast-track both beginners and those looking to upskill in the field of data analytics. Over three months, and with no prerequisite knowledge, this certificate equips learners with fundamental skills in data analysis using Excel and the R programming language. The course offers hands-on projects reflecting real-world scenarios, enhancing practical expertise. With the rapidly growing demand for data analytics professionals, this program is a solid investment in your career, providing a shareable certificate and relevant skills that align with industry needs. If you aspire to excel in the world of data analytics, this program offers a valuable starting point and a promising pathway to career advancement.
Pros
- Gets you job-ready in three months
- Hands-on and interactive labs
- Shareable certificate from IBM
- Skills acquired relevant for branching out to other fields
- No prior experience required
Cons
- Tricky for beginners with no programming experience
- Lack of detail for some concepts
Get 40% off your first year of Coursera Plus Annual — unlimited access to 10,000+ courses (new subscribers only)

Careers in data analysis
The Professional Certificate is designed to help learners from all streams, whether they are fresh graduates, students, professionals, or involved in any analytics role. As a student, you can either aim to master data analytics as a career path or use it as a stepping stone to build foundations for other fast-growing data professions like data science, business analytics, data engineering, and business intelligence analytics. My goal while taking this program was the latter – I used it to strengthen my concepts in data analytics so I can be better prepared for a master’s degree in data science and start my career as a data scientist.
The program also provides insights into a day in the life of a data analyst, as practicing data analysts share their experiences and insights on breaking into this field. The course also delves into potential career paths and learning routes to consider, shedding light on what employers seek in a data analyst. Furthermore, you’ll benefit from the knowledge and best practices shared by professionals regarding various aspects of the data analysis process. The future in this domain holds immense promise, both for the field and for you as a data analyst.

Level and prerequisites
The Certificate is designed for anyone who wishes to develop a strong foundation in data analytics. As such, it has no prerequisites. It is a beginner-level course and assumes no prior knowledge of Excel or R. However, since it delves quite deep into analytics and data presentation skills and aims to get you ready for a job as a Junior Data Analyst in just three months, the difficulty level increases quite steeply after the first few courses.
I would suggest that if you have at least some familiarity with using Microsoft Excel. If you also have basic programming experience in any language, navigating the syntax and working of the R programming language and understanding the data visualization techniques will be easier for you. While I personally found the course easy to follow, I have ample experience in programming and using Excel. However, if you have the dedication and commitment to learn, this program will be easy for you even without any experience.
Cost
The program operates on a monthly subscription model, costing $51 per month. Given that the course is designed to be completed in about three months at a self-paced rate, the total expenditure would only be approximately $153 if you stick to the suggested timeline.
It’s worth noting that this particular Professional Certificate isn’t part of the Coursera Plus subscription and, therefore, requires a separate purchase. However, if you’re mindful of your budget, you can aim to finish the program in less than the recommended three months, which could halve the overall cost.
Is it worth the money?
Considering the intensive curriculum, hands-on projects, and industry-aligned skills acquired through the IBM Data Analytics with Excel and R Professional Certificate, the investment is undoubtedly worth the cost. The program offers a highly concentrated and effective approach, providing learners with the essential tools and knowledge required for a successful career in data analytics. In a mere three-month timeframe, beginners can delve into this dynamic field without prior knowledge, making it an accessible option.
The program not only equips learners with foundational data analytics skills but also ensures they gain practical experience through projects relevant to real-world scenarios. The industry’s rapid growth and the burgeoning demand for data analytics professionals underscore the relevance and potential of this field, making the shareable certificate a valuable asset that can considerably boost career prospects. With these factors in mind, the investment in this professional certificate is well-justified, promising a solid foundation and promising growth opportunities in the expansive field of data analytics.
Instructors
The design and creation of the Professional Certificate has been completely carried out by IBM – all of the course instructors are highly skilled IBM employees. The lecturers are IBM’s Global Programme Director Rav Ahuja; Saishruthi Swaminathan, a data scientist and developer advocate in the IBM CODAIT team who mainly focuses on democratizing data and AI through open source technologies; and the IBM Skills Network, a group of seasoned and highly skilled authors, content producers, and educators who work together to provide crucial online courses in technology, data science, artificial intelligence, and related fields.
Structure
The Professional Certificate comprises nine courses, with a recommended total completion time of three months. All courses have content estimated to take 1 to 26 hours to complete. The longer courses are divided into multiple modules.
Each topic covered in a module ends with a graded assignment, which can be an MCQ quiz or an external app graded item. Each course contains a course introduction video, course content videos, readings, practice quizzes, and the graded assignments at the end. The practice quizzes are a good revision to make sure that you fully understand the concepts covered in videos and are ready to take the graded assessment.


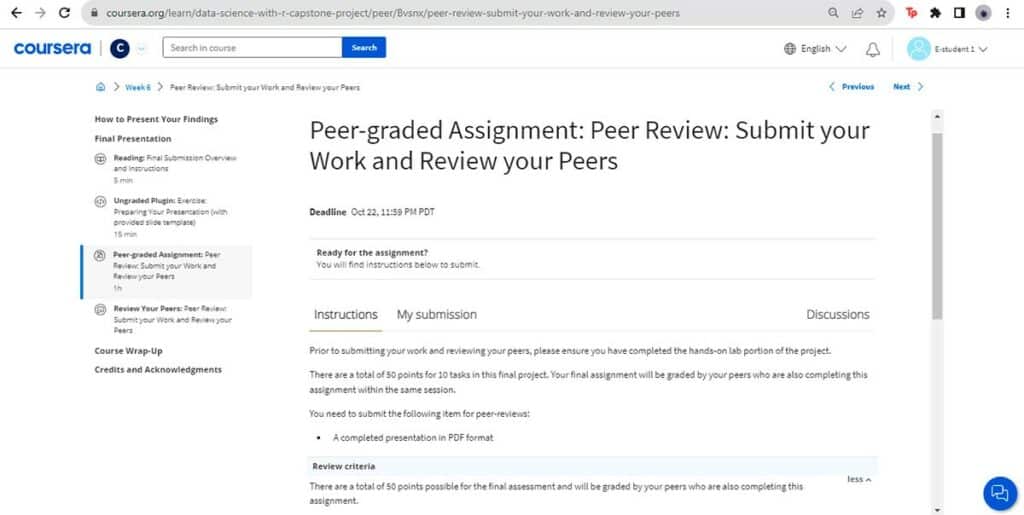
Some courses include peer-graded assignments, where you receive comments from other students. You also have the opportunity to evaluate and comment on the work of others. Learning from the work of others and using your knowledge to aid in their learning is a useful exercise. Additionally, it fosters a more natural learning environment where you can interact with classmates and experience a sense of community. The peer-graded assignments are usually worth 10% of the final grade.
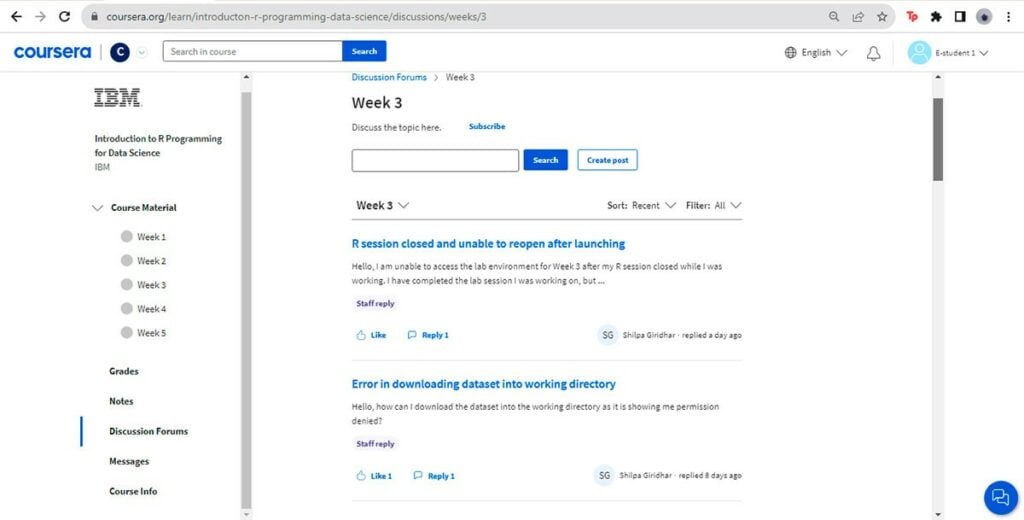
The courses also contain a discussion forum where you can put in questions or queries that require clarification, get answers, and connect with other students who have taken or are currently taking the course. Your knowledge and ideas can also benefit other students, and it overall creates a sense of being part of a class with similar students. Whether you’re having trouble navigating the external labs, grasping a concept, completing a quiz, or just need more knowledge on a topic, the discussion forum helps you talk to other students studying the same material.
Syllabus
The program’s 9 courses are as follows:
- Introduction to Data Analytics
- Excel Basics for Data Analysis
- Data Visualization and Dashboards with Excel and Cognos
- Assessment for Data Analysis and Visualization Foundations
- Introduction to R Programming for Data Science
- SQL for Data Science with R
- Data Analysis with R
- Data Visualization with R
- Data Science with R – Capstone Project
Let’s have a look at each of these courses in more detail.
Course 1: Introduction to Data Analytics
This course offers a comprehensive introduction to the field of data analysis. The course begins by familiarizing students with the data ecosystem, covering databases, data warehouses, data marts, data lakes, and data pipelines. It also explains the roles of various data professionals and delves into the fundamental steps of the data analysis process, from gathering and cleaning data to analyzing and communicating insights through visualizations and dashboards. Students will gain insights into different data structures, file formats, data sources, and languages used in data analytics, including an introduction to Big Data platforms like Hadoop, Hive, and Spark. The course emphasizes the importance of statistical analysis and data visualization in understanding patterns and trends within data, providing a foundation for a career in data analysis.

By the end of the course, you will have a solid understanding of the roles, expectations, and responsibilities of data analysts, proficiency in data handling and visualization, and the ability to analyze data effectively for meaningful insights. The course does not require any prior experience in data analysis, making it accessible to beginners in the field.
Course 2: Excel Basics for Data Analysis
This course aims to equip learners with essential skills in utilizing spreadsheet tools like Microsoft Excel for effective data analysis, with no required experience. It covers fundamental aspects such as navigating Excel’s interface, viewing, entering, editing, and organizing data, along with learning common functions utilized by data analysts. Students also gain insights into maintaining data quality, handling data privacy, and employing tools for data standardization and manipulation. The course culminates in a final project where learners showcase their proficiency in cleaning, preparing, and analyzing real-world data using Excel.

You will engage in hands-on labs and practical applications, focusing on applied learning and active practice. Key topics encompass data wrangling, cleansing, analysis techniques, and the creation of pivot tables for organized data representation. The course promotes a practical and skill-driven approach, emphasizing real-world data analysis scenarios.
Course 3: Data Visualization and Dashboards with Excel and Cognos
This course focuses on empowering learners to effectively communicate data analysis findings through compelling visualizations and interactive dashboards. It covers fundamental steps in creating data visualizations without requiring any coding. The course begins by introducing learners to basic chart types and pivot chart visualizations using Excel. It then progresses to advanced visualizations like treemaps, histograms, and filled map charts, along with Excel PivotChart features. Students also learn to assemble visualizations into a comprehensive Excel dashboard. The course extends beyond Excel by introducing IBM Cognos Analytics, a business intelligence tool enabling learners to create interactive dashboards. You can gain practical experience in developing visualizations and interactive dashboards using both Excel and Cognos Analytics, culminating in a portfolio-ready project for potential employers or peers.

The course emphasizes the significant role that data visualizations play in data analysis, highlighting the ability to create various types of charts, graphs, and interactive dashboards using Excel and Cognos Analytics. By the course’s conclusion, you will have a solid understanding of creating impactful visual representations of data, aiding in clear and engaging communication of analytical insights.

Course 4: Assessment for Data Analysis and Visualization Foundations
This course serves as the concluding segment of the Data Analysis and Visualization Foundations. It involves a graded final examination encompassing key content from three preceding courses: Introduction to Data Analytics, Excel Basics for Data Analysis, and Data Visualization and Dashboards with Excel and Cognos. It will evaluate you on a broad spectrum of knowledge, from understanding the data ecosystem and fundamental data analysis concepts to hands-on skills like data gathering, data cleaning, and data visualization using Excel and IBM Cognos. The examination covers Excel-related topics such as spreadsheet usage in data analytics, data wrangling, pivot tables, and extends into using IBM Cognos for data visualization.

Furthermore, it ensures proficiency in utilizing Excel and IBM Cognos for data visualization, along with foundational Excel tasks for effective data analysis. The final examination serves as a capstone, affirming your capabilities to navigate and contribute to the modern data ecosystem.
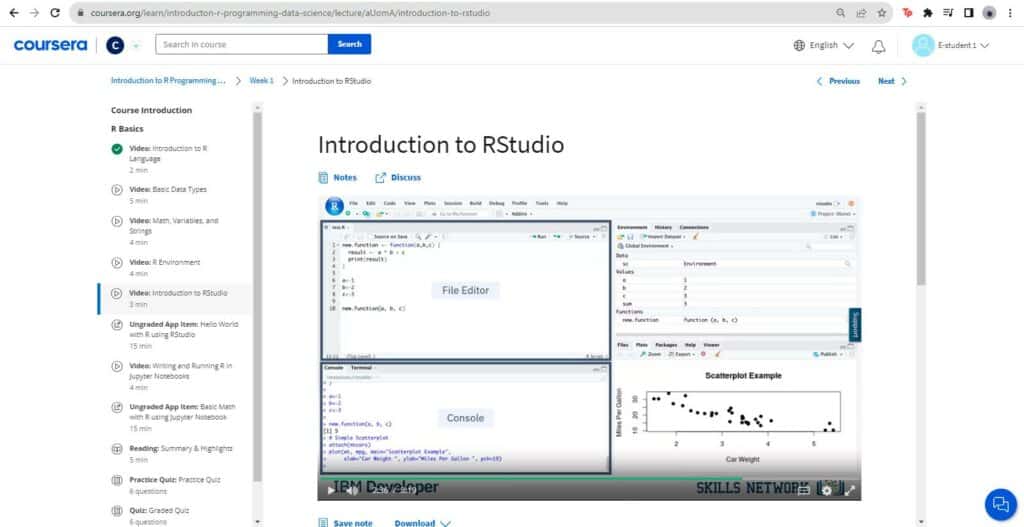
Course 5: Introduction to R Programming for Data Science
This course is designed to introduce you to the essential aspects of the R language, a critical tool in data analysis. It covers fundamental concepts such as data types, techniques for data manipulation, and basic programming tasks. The emphasis of the course is on hands-on and practical learning, encouraging students to write simple programs using RStudio and Jupyter Notebooks, manipulate data within data frames or matrices, and complete a final project that involves acquiring and analyzing data-driven insights using Watson Studio and Jupyter notebooks. The course does not require any prior knowledge of R or programming, making it accessible to beginners.
Throughout the course, you will engage with common data structures, programming fundamentals, and methods to manipulate data using the R programming language, setting the foundation for data analysis. Furthermore, the course covers important programming tasks, including controlling program flow, defining functions, and working with different data types. The final sections focus on the acquisition and manipulation of data from various sources, enhancing your ability to work with real-world datasets and perform data-driven analysis and visualizations.
Course 6: SQL for Data Science with R
This course focuses on equipping you with essential skills in SQL (Structured Query Language), a crucial tool for data extraction and manipulation from databases, especially for those aspiring to follow a career in data science. The course begins by introducing the foundational concepts of relational databases and SQL, emphasizing its pivotal role in unlocking insights stored within databases. Through practical hands-on labs and real-world datasets, you will engage in activities like creating database instances in the cloud, building SQL queries, and accessing databases using SQL from Jupyter notebooks.

The course also delves into utilizing R to connect with relational databases, store and retrieve R data structures in files, and perform effective data analysis through the integration of R and databases. The weekly objectives cover fundamental SQL statements and syntax, understanding relational databases and table manipulation, data retrieval using string patterns and ranges, and connecting R with relational databases. The course ultimately prepares you to effectively interact with databases and leverage SQL for data science in conjunction with R. It requires no prior knowledge of databases, SQL, R, or programming, making it accessible to beginners.

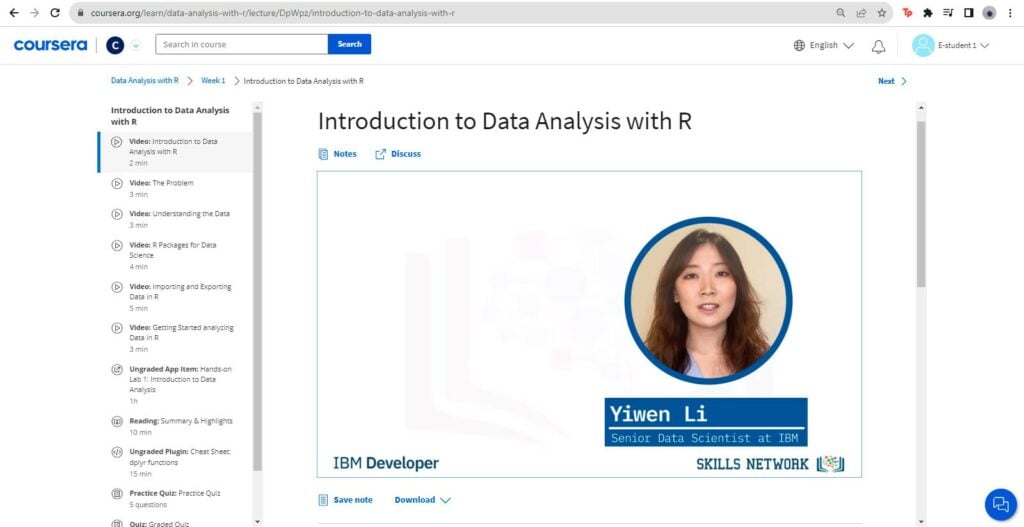
Course 7: Data Analysis with R
This course is designed to equip you with essential skills in utilizing the R programming language for data analysis. Starting with a question to be answered through data, the course guides you through the process of data preparation, exploratory data analysis, model development, and model evaluation. You will engage in a hands-on experience by playing the role of a data analyst, analyzing airline departure and arrival data to predict flight delays using a real Airline Reporting Carrier On-Time Performance Dataset.

The course emphasizes the importance of data wrangling or pre-processing to transform raw data into an analyzable format. Techniques like data binning, handling missing values, normalization, and converting categorical variables into quantitative values are covered. Additionally, exploratory data analysis techniques are introduced to uncover meaningful relationships and characteristics within the dataset, facilitating insights into the problem being addressed. The course follows a structured approach, guiding learners through understanding the dataset, using the dplyr package for analysis, exploring descriptive statistics, developing models using regression techniques, and evaluating models using the tidymodels framework.
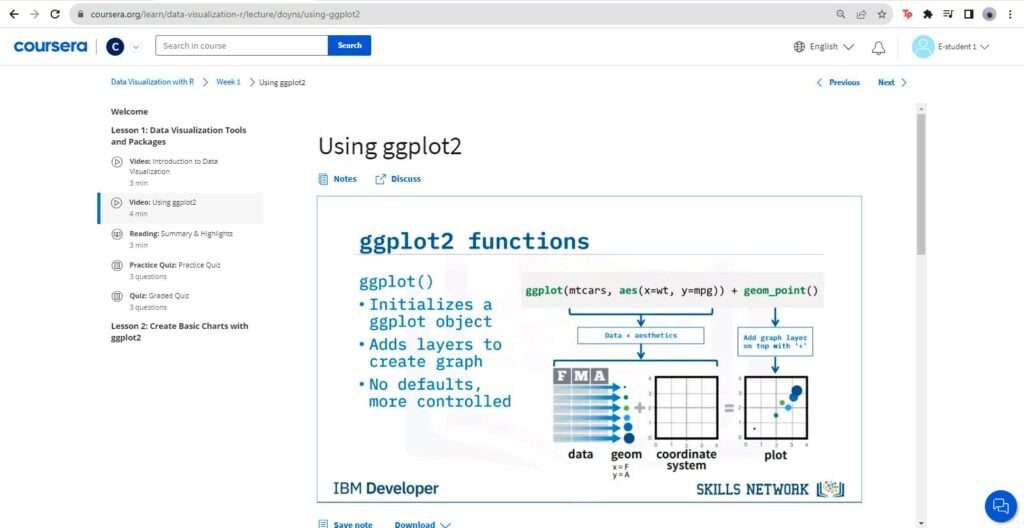
Course 8: Data Visualization with R
This course is designed to help you understand data visualization techniques and tools using the R programming language. The course begins by teaching the Grammar of Graphics, a framework for constructing and describing various types of graphs. It then introduces the ggplot2 data visualization package, showcasing how this package can be used to create diverse visualizations such as bar charts, histograms, pie charts, line plots, scatter plots, and box plots. You are guided in customizing these visualizations and making informed choices based on their data types and objectives.
Additionally, the course covers the Leaflet package, allowing you to create map-based visualizations based on geolocation data. The importance of interactive dashboards is emphasized, and you’ll be introduced to the Shiny package to build and deploy interactive dashboards, enhancing data exploration and stakeholder engagement. Prerequisites include basic R programming skills, making it suitable for individuals with prior exposure to R programming.
Course 9: Data Science with R – Capstone Project
This course is the culminating course in the IBM Data Science with R Specialization. In this capstone project, you will assume the role of a Data Scientist within an organization, facing a real-world challenge that demands data collection, analysis, hypothesis testing, visualization, and modeling. The project involves working with diverse datasets, utilizing tools like Tidyverse, SQL, ggplot2, and more. The tasks encompass data wrangling, exploratory data analysis (EDA), linear regression modeling, visualization, and the creation of an interactive dashboard. You will apply your acquired knowledge, understanding, and skills to deliver a data analysis report, including an executive summary for stakeholders, demonstrating a comprehensive understanding of data science principles.

You’ll be involved in web scraping, data cleaning, EDA techniques, linear regression modeling, and interactive visualization using tools like Leaflet and R Shiny. The course ensures that learners can effectively apply data science techniques and present their findings in a meaningful and actionable way, showcasing their abilities to potential employers and stakeholders.
What do others say?
The overall reviews about the program are positive and appreciative, with people appreciating the practical exercises and labs for learning Excel and R. Many mention that the course is best suited for those who already have programming experience and that complete beginners might need more practice and revision time. Others mention that the courses are quite interactive, well-structured, and easy to follow. They also mention that the peer-graded assignments were a good way to gain a better understanding of the concepts, and having their work evaluated by others taking the same course made them feel like part of a community and increased their motivation for doing a better job. Overall, the reviews are mainly positive and encouraging, with no major negative points to highlight.

Alternatives and complements to this Certificate
While this Professional Certificate is a good choice to build your data analytics skills, exploring other options before committing to one channel is always a good idea, as it helps you compare the different features of all available options and then make a well-informed choice on what suits you best and gives you the best value for money. The Google Data Analytics Professional Certificate on Coursera is a similar program, although longer and more comprehensive, that equips you with crucial data handling and visualization skills and gets you job-ready. Similarly, the IBM Data Analyst Professional Certificate on Coursera is also a data-centric program for aspiring Data or Business analysts, but it focuses more on the Python programming language instead of R and Excel.
Conclusion and recommendations
In conclusion, the IBM Data Analytics with Excel and R Professional Certificate on Coursera is a meticulously designed program that offers a fast-track route into the burgeoning field of data analytics. Geared toward both beginners and those looking to upskill, this certificate equips you with essential data analysis skills using Microsoft Excel and the R programming language. The carefully crafted curriculum, inclusive of hands-on projects, exposes you to diverse data analysis projects such as fleet vehicle inventory analysis, COVID-19 testing data trends, and more.
This program aligns with the ACE® recommendations, allowing you to earn up to 15 college credits, underscoring the rigor and academic quality of the certification. This underscores the academic rigor of the program and provides you with a pathway to earning college credits and validating your learning journey.
To those aspiring to carve a niche in the data analytics domain or enhance their existing skills, I highly recommend considering this professional certificate. The industry-focused projects, comprehensive coverage of vital tools and libraries, and the potential to earn college credits make it a valuable investment in your professional development. As the demand for professionals in data analytics continues to surge across various industries, possessing the skills imparted by this certificate can significantly enhance your employability and open doors to a plethora of exciting career opportunities. Whether you are at the outset of your career or seeking to pivot into the data analytics realm, this program provides an excellent foundation and prepares you to excel in this dynamic and data-driven landscape. Embrace this opportunity, complete the program, and set yourself on a rewarding journey in the field of data analytics!
Get 40% off your first year of Coursera Plus Annual — unlimited access to 10,000+ courses (new subscribers only)
Read Next

Originally published October 3, 2023