If you’re thinking of following a data science or data analysis career path, you’ll come across Tableau sooner or later. Trusted by some of the world’s biggest companies like Amazon, LinkedIn, and Walmart, Tableau is one of the most popular data visualization tools used in the business intelligence (BI) and analytics industry.
The reason Tableau is so widely used is simple: it helps people see and understand data intuitively. With Tableau, you can take massive volumes of data from anywhere and turn it into understandable and actionable insights. This can obviously save you a ton of time.
And time is something all data scientists want to save. You see: data scientists are busy folk. Yet, most of them waste almost 50% of their time a week preparing data. Too much time spent on data preparation is the top challenge most data scientists face daily, followed by things like overly complicated analytic tools and lack of training.
Extensive knowledge in Tableau will not only give you a competitive advantage in the job market. It’ll also save you time when you finally land a job in data science and help you excel in your career.
The good news is that with its superb drop-and-drag functionality, it’s very easy to learn Tableau online, even if you have no coding experience. However, not every Tableau online course will be worth your time — or money. Below we have rounded up seven of the best Tableau courses that’ll transform you into a Tableau expert.
These are the best Tableau courses.
Best Tableau Courses
Best Overall: Business Analytics Nanodegree (Udacity)

- Curriculum developed in collaboration with Tableau and Mode
- Career support services provided upon graduation
- Students are mentored through real-world Tableau projects
- Covers not only Tableau, but also SQL and Excel
Cons
- Time intensive
Udacity’s “Business Analytics Nanodegree” is a beginner-level online Tableau course developed in collaboration with Tableau and Mode. As the syllabus was developed with the Tableau team, students can rest assured knowing that they are learning Tableau exactly how it was meant to be used. No interpretations or opinions: you’re getting knowledge straight from the source.
The lessons covered in this program will teach you the skills needed for data analysis in a business environment. But, the methods taught here apply not only to business but also to other industries that benefit from visual data analytics. And, as data analysis is a major influence on virtually all industries, this also means that the lessons here can be applied to nearly every industry in the world.
Here are a few more reasons why placed this Tableau course above the rest:
- In addition to Tableau, it covers the fundamentals of SQL and Excel
- You’ll gain individual one-on-one feedback from qualified mentors
- Every major topic covered in the program includes a hands-on student project
- Does not require any pre-existing programming or data knowledge
For these reasons and more, we felt that Udacity’s Business Analytics Nanodegree was easily deserving of the #1 ranking. It’s comprehensive, beginner-friendly, and superb at covering all the fundamentals of data science and analysis. If you want to go from “Zero to hero” as a Tableau user, this is the course to go with.
Best for Certification: Data Visualization with Tableau Specialization (Coursera x UC Davis)
40% ($140 USD) off your first year of Coursera Plus Annual (expires 2 December 2024)
- Beginner-friendly
- Includes hands-on projects
- Provides an accredited Tableau certificate
- Financial aid available
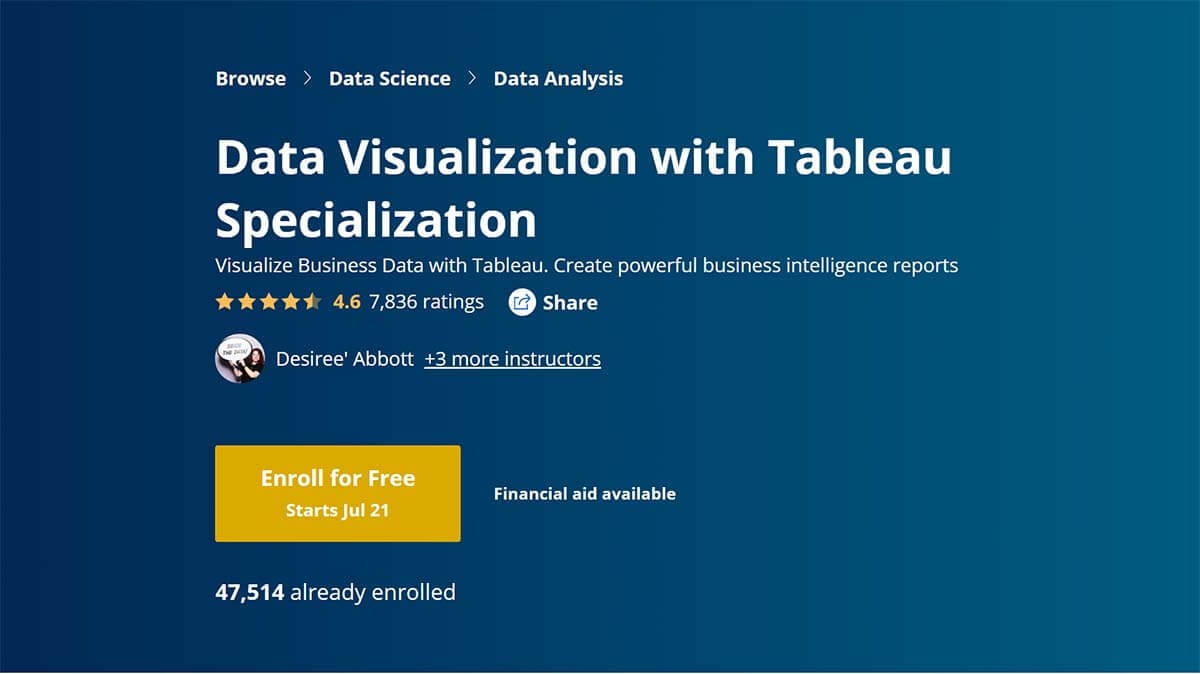
Offered by UC Davis in collaboration with Tableau, the “Data Visualization with Tableau” specialization is a five-course program that’ll teach you the fundamentals of data visualization, including how to use the Tableau software in a professional business setting.
The Specialization consists of pre-recorded video lessons, external readings, auto-graded quizzes, peer-reviewed assignments, and community discussion forums where you can debate things like the pros and cons of pie charts.
At the end of the Specialization, students complete a capstone project. During this project, you learn how to develop a project proposal, create KPIs, perform exploratory analysis, and create visualizations.
Since this program is available on Coursera, you can audit course material for free. However, to get a certification, you’ll need to enroll in the program. Because Coursera charges a monthly subscription fee, there’s an incentive to get through the program as fast as possible. If you dedicate about three hours a week to this course, you can expect to complete the entire Specialization in about six months. Note that Coursera provides financial aid to those who can’t afford the fee.
Although there are no prerequisites for taking this program, students should be reasonably comfortable working with data and datasets.
All in all, Coursera’s Data Visualization with Tableau Specialization is, without a doubt, another one of the best Tableau online courses out there. According to Coursera, as many as 42% of students started a new career after completing this course and 12% received a pay increase or promotion.
Best for Beginners: Introduction to Tableau (DataCamp)

50% off Unlimited Data and AI Learning (expires 28 March 2024)
- No prerequisite Tableau skills necessary
- Takes only 4 hours to complete
- Interactive exercises
- Chapter 1 is free
Cons
- Pricey if this is the only DataCamp course you want to take
Learn Tableau online with DataCamp’s “Introduction to Tableau“, an interactive course divided into four chapters: Getting Started with Tableau, Building and Customizing Visualizations, Digging Deeper, and Presenting Your Data. These are split into 29 videos and 70 exercises.
You start with the basics, like how to use Tableau’s drag-and-drop interface before taking it up a notch and learning more advanced Tableau skills like how to slice and dice data with filters, how to put data on a map visualization, and how to create dashboards to share data with others.
The course curriculum is taught through video lessons and hands-on exercises. For example, in section one, students are tasked with creating a table that shows New York’s neighborhood AirBnB listing prices and the number of days these listings were occupied in 2019, segmented by neighborhood and room type. You then have to visualize these results with Tableau.
No prior experience with data visualization or Tableau is required to get started with this course. If you’re not 100% sure if this course is what you’re looking for, you can try the first chapter for free. After that, you’ll need to subscribe to one of DataCamp’s pricing plans, which start at $25 when billed yearly. All in all, the course should take you about four hours to complete.
DataCamp’s Introduction to Tableau, which includes a ton of practical exercises, is one of the best Tableau courses out there, especially if you learn best by doing and want a quick introduction to working with Tableau. For beginners, it’s our top choice for studying Tableau online.
Big Data Analytics with Tableau (Pluralsight)
- Bite-sized content
- Hands-on exercises
- Great content for intermediate learners
Cons
- Only 4 hours long
- Some prior Tableau skills necessary
Ideal for intermediate learners, “Big Data Analytics with Tableau” covers the basics of big data systems and shows you how to access these systems with the Tableau software. The course is divided into six distinct sections that cover topics like accessing and visualizing big data with Tableau, big data in the cloud, big data analytics, and MPP databases.
Each section is between 10 minutes and one hour long. However, because the sections are further divided into smaller sub-sections (between 1 minute and 20 minutes long), you don’t necessarily have to spend a full hour learning if you’re short on time. That being said, the entire course is under four hours long, so if you’ve got a spare afternoon, you can master the fundamentals of big data and Tableau in no time.
The course is taught by Ben Sullins, a self-described data nerd who has 15 years of industry experience and who has worked with countless high-tech companies, such as LinkedIn, Facebook, and Cisco.
Get to grips with big data and one of its most popular visualization tools in under four hours with Big Data Analytics with Tableau, a superb Tableau online course.
Tableau Desktop Playbook: Building Common Chart Types (Pluralsight)
- Taught by 2018 Tableau Zen Master
- Focuses on Tableau charts
- Under 4 hours long
Cons
- Students should be familiar with Tableau
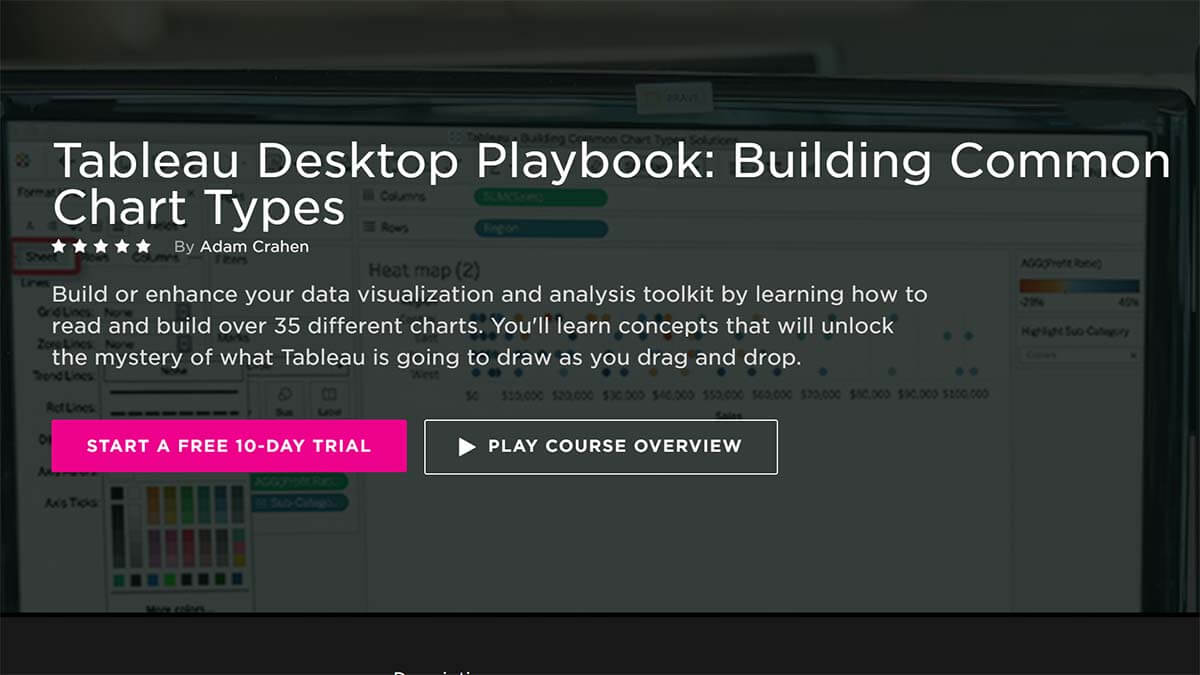
As the title of this course suggests, Pluralsight’s “Tableau Desktop Playbook: Building Common Chart Types” will teach you how to read, build, and format various different charts (such as bar charts, donut charts, and lollipop charts) with Tableau. The course also goes over the foundational and advanced concepts that everyone should be aware of when working with Tableau.
The course, which is just under four hours long and is divided into five sections, is taught by Adam Crahen, the Head of Data Visualization Engineering for Pluralsight and 2018 Tableau Zen Master — so you know you’re in good hands.
Before enrolling in this course, students should be familiar with Tableau’s primary purpose, have basic knowledge of navigating through the tool, and know how to connect to data. A basic understanding of analytics is helpful but not necessary.
Pluralsight’s “Tableau Desktop Playbook: Building Common Chart Types” is one of the best Tableau courses for learning about the different charts available in Tableau and how to choose the right chart type for your data.
Tableau 2022 A-Z: Hands-On Tableau Training for Data Science (Udemy)

New customer offer! Top courses from $14.99 when you first visit Udemy (expires 31 March 2024).
- Takes only 10 hours to complete
- Frequent discounts
- Quizzes to test your knowledge
Cons
- Not enough hands-on exercises
- Lecturer sometimes goes too fast
Available on Udemy, the “Tableau A-Z: Hands-On Tableau Training for Data Science” course is a comprehensive introduction to Tableau. The course includes over eight hours of on-demand video, six articles, and real-life data analytics exercises and quizzes.
You don’t have to have any prior Tableau experience to enroll in this course. In fact, the course begins with Tableau basics, so you’ll learn how to install and navigate the tool before moving on to more advanced concepts, like finding trends in your data.
As you progress through the course, you’ll learn how to summarize information using aggregations and create charts, maps, and interactive dashboards. The final section of the course focuses on the latest features of data presentation in Tableau 10, like treemap charts and storylines.
Even though this course costs a few hundred dollars, it’s a worthwhile investment if you want to learn the ins and outs of Tableau. Besides, Udemy runs frequent discounts. If you’re lucky (or patient), you can get this course for a fraction of the cost.
Also worth noting is the fact that when you purchase a course on Udemy, you get full lifetime access to it. Seeing how content in this course is updated every time new versions of Tableau are released, this course should help you keep your Tableau skills up to date for years to come.
If you have 10 hours to spare, the “Tableau A-Z: Hands-On Tableau Training for Data Science” can help you become highly proficient in using Tableau, even if you’ve never used the popular business intelligence tool before in your life.
Tableau Data Analyst/Specialist Desktop Certification (Udemy)

New customer offer! Top courses from $14.99 when you first visit Udemy (expires 31 March 2024).
- You don’t need to have any Tableau skills
- Covers content for Tableau certifications
- Contains practical exercises
Cons
- Some exercises are too simple
- Could use more real-world examples
Udemy’s “Tableau Data Analyst/Specialist Desktop Certification” is made up of 145 lectures, which include 13 hours of on-demand video, 18 articles, and 4 downloadable resources.
The course covers more or less everything you need to know to pass the Tableau Desktop Certified Associate exam or the Tableau Desktop Specialist exam, starting with the basics, like learning how to install and navigate Tableau Public and ending with lessons on how to create dashboards and storyboards.
The course is intuitive and broken down in an organized manner that makes it easy to learn. For example, you’ll learn how to design a simple bar chart before you create a stacked bar chart with colors. Moreover, the course shows you a few “wrong turns” so that you’re aware of the type of problems that could arise — and how to overcome them. It also helps that throughout the course, students can test their skills with 10 practice activities. Most students complete the course in about 11 hours.
No prior experience in reporting tools is required. However, students that know how to use reporting tools like Microsoft Access and Yellowfin might find the course easier.
Again, the course will set you back a few hundred dollars but is still great value. For the price, you get unlimited lifetime access to the course and any updates (for example, the course was last updated in May, when Tableau 2020.2 was released). The course is often on sale, too, so keep an eye out for (generous) discounts.
Tableau certifications are an excellent way to get ahead. This course will help you prepare for either the Tableau Desktop Specialist or the Tableau Desktop Certified Associate exam.
