
Contents
Coursera Professional Certificate – IBM Data Analyst
➔
★★★★★ 4.7 / 5
Ready to unlock the secrets hidden within data? The IBM Data Analyst Professional Certificate on Coursera provides a structured path for mastering essential skills in data analysis. With nine courses covering everything from Python to SQL and data visualization tools, this program ensures you are equipped to tackle real-world challenges. Through practical projects and a capstone assignment, beginners or those with some existing experience will gain hands-on experience and industry recognition, setting you up for success in the competitive job market.
Pros
- Professional-level training
- Accessible to beginners
- Eligible for ACE credits
- Financial aid available
- Industry-recognized certificate from IBM and Coursera
Cons
- Basic computer and math knowledge required
- Not included in Coursera Plus
- Limited advanced topics
Get 40% off your first year of Coursera Plus Annual — unlimited access to 10,000+ courses (new subscribers only)
Course overview
The IBM Data Analyst Professional Certificate on Coursera encompasses a comprehensive curriculum spanning nine courses, each tailored to enhance learners’ data analysis skills. Beginning with foundational concepts, participants gradually advance through various analytical tools and techniques, including Python, Excel, SQL, and data visualization methods. Practical experience is emphasized through hands-on projects covering diverse domains such as fleet management, financial analysis, and predictive modeling.
A notable feature of the program is its practical orientation, allowing learners to build a robust portfolio showcasing their analytical prowess. The program culminates in a capstone project, providing an opportunity for learners to apply their skills to solve real-world data analysis challenges. Upon successful completion, learners receive a Professional Certificate from IBM, validating their expertise and enhancing their employability.
Recognized by ACE® and ECTS via FIBAA, the program also offers the opportunity to earn college credits in both American and European universities, further bolstering its credibility. Moreover, access to career resources such as mock interviews and resume support ensures learners are well-equipped for the job market, cementing the program’s relevance in today’s data-centric landscape.
The IBM Data Analyst Professional Certificate program on Coursera offers a comprehensive learning journey, equipping engineers and aspiring analysts with the tools and knowledge needed to excel in data analysis roles. With its practical approach, industry recognition, and career support, this program serves as a valuable asset for engineers seeking to harness the power of data in their professional endeavors. As we continue exploring into this review, we will explore how this program can empower engineers to navigate the complexities of data analysis and drive innovation in their fields.
Is the IBM Data Analyst Professional Certificate worth the investment?
Priced at a monthly subscription of $51, the total cost of the IBM Data Analyst Professional Certificate for the 3 to 4-month program ranges from $153 to $204 (but could be less or more, depending on how quickly you complete it). This fee grants access to a comprehensive curriculum covering essential data analysis tools and techniques, including Python, Excel, SQL, and data visualization tools like IBM Cognos Analytics. The program also offers practical, hands-on projects designed to provide learners with real-world experience in data analysis.
It is important to note that IBM Professional Certificates are not included in the Coursera Plus subscription – you will need to purchase these certificate programs directly instead. Additionally, while individual courses within the certificate can be purchased for lifetime access, this option may increase the overall expense.
While there is a free audit option available, it does not include access to hands-on exercises or the certificate upon completion. Overall, the value of investing in the IBM Data Analyst Professional Certificate depends on your professional goals and the importance you place on gaining practical experience and certification in the field of data analysis. Consider whether the skills and knowledge gained align with your career aspirations in data analytics before making a decision.
Detailed review
The program includes courses covering various aspects of data analytics in nine courses:
- Introduction to Data Analytics
- Excel Basics for Data Analysis
- Data Visualization and Dashboards with Excel and Cognos
- Python for Data Science, AI & Development
- Python Project for Data Science
- Databases and SQL for Data Science with Python
- Data Analysis with Python
- Data Visualization with Python
- IBM Data Analyst Capstone Project
Each course focuses on different fundamentals of data analytics and practical applications, suitable for beginners and experienced learners alike.
Course 1: Introduction to Data Analytics
The first course in this series is the “Introduction to Data Analytics,” where learners embark on a comprehensive journey into the world of data analysis. Through ten hours of engaging content, participants are introduced to the fundamental principles and processes of data analytics. The course covers a wide array of topics, including the definition of data analytics, key steps in the data analytics process, different data roles such as Data Engineer and Data Scientist, and various data structures, file formats, and sources.
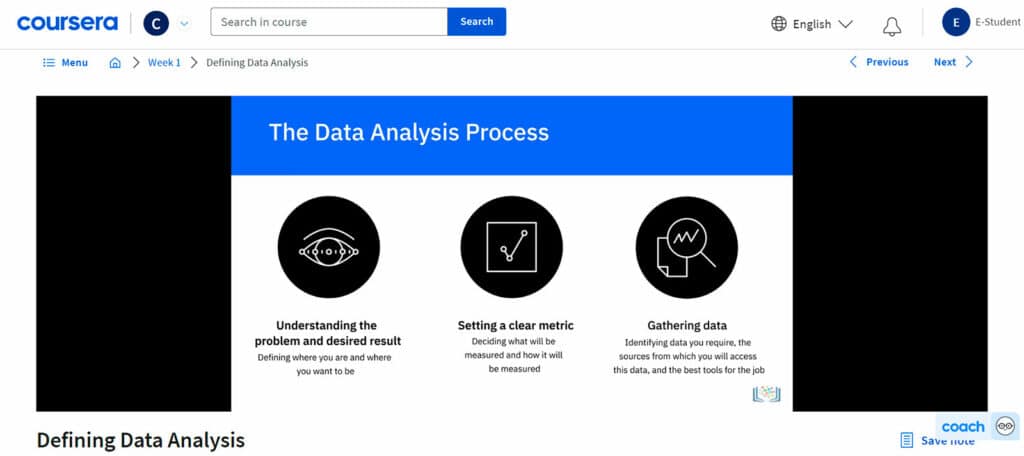
Participants gain a solid understanding of the data analysis process, which involves collecting, wrangling, mining, and visualizing data to extract actionable insights. By the end of the course, learners are equipped with the essential knowledge and skills necessary to begin their journey in the field of data analytics. They develop a strong foundation that sets the stage for further exploration and learning in subsequent courses. Learners explore the role of a data analyst, essential tools, and the data ecosystem. They gain insights into databases, data warehouses, data marts, and Big Data platforms like Hadoop and Spark. By the course’s end, participants can gather, clean, analyze, and visualize data, culminating in a practical final project. This module provides a solid entry point to the IBM Data Analyst Professional Certificate. It gently introduces learners to data analysis concepts without requiring prior experience. Real-world applications and a final project test comprehension and practical skills.
Overall, Introduction to Data Analytics serves as a vital stepping stone for individuals looking to enter the exciting and rapidly growing field of data analytics. Whether you are a novice or have some experience in data analysis, this course provides valuable insights and practical skills to kickstart your career in this dynamic industry.
Course 2: Excel Basics for Data Analysis
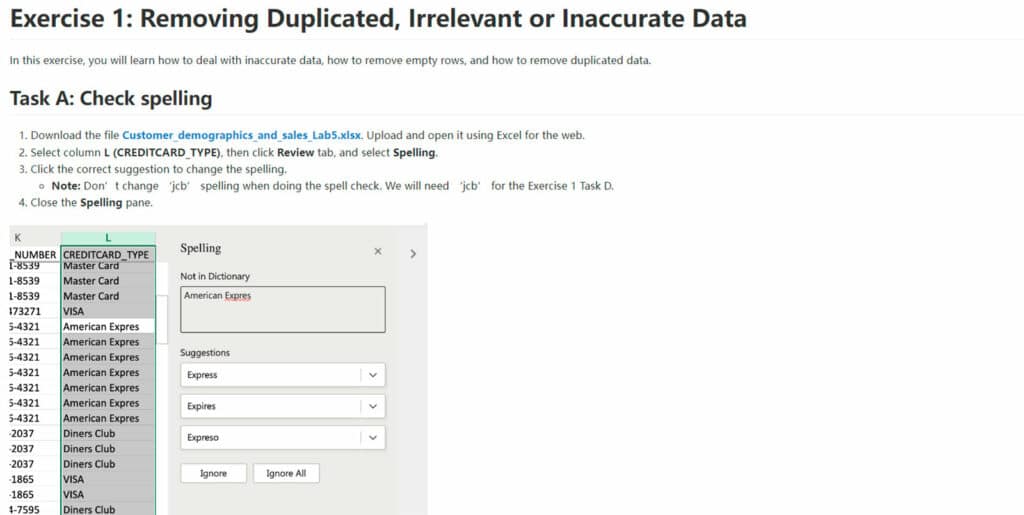
“Excel Basics for Data Analysis” offers participants a practical introduction to using Microsoft Excel for data analysis tasks. Over the course of eleven hours, learners delve into the essential spreadsheet techniques and functions required for effective data analysis. The course covers a range of topics, including data entry, formula usage, data quality techniques, and analysis tools such as filters, sorting, and pivot tables. With no prior experience required, learners are introduced to spreadsheet tools like Microsoft Excel and Google Sheets, providing a platform for hands-on learning and practical application of data analysis techniques.
Through a series of hands-on exercises and real-world examples, participants gain proficiency in leveraging Excel as a powerful tool for data analysis. They learn how to manipulate data, perform basic and advanced calculations, and visualize data using Excel’s built-in features. By the end of the course, learners are equipped with the skills to tackle data analysis tasks with confidence and efficiency, making Excel an invaluable asset in their analytical toolkit.
Overall, “Excel Basics for Data Analysis” provides a solid foundation for individuals looking to enhance their data analysis skills using Microsoft Excel. Whether you are a beginner or have some experience with Excel, without the need for coding knowledge, this course offers valuable insights and practical techniques to excel in data analysis tasks using one of the most widely used spreadsheet software in the industry.
Course 3: Data Visualization and Dashboards with Excel and Cognos
In “Data Visualization and Dashboards with Excel and Cognos,” participants dive into the art of visual storytelling with data. Over the course of fourteen hours, learners explore various visualization techniques using Microsoft Excel spreadsheets and Cognos Analytics. The course covers a range of topics, including creating basic visualizations such as line graphs, bar charts, and pie charts using Excel, as well as constructing advanced visualizations such as treemaps, sparklines, histograms, and scatter plots.
The curriculum begins with the basics of data visualization in Excel, covering essential chart types like line, pie, and bar charts. As learners progress, they delve into more advanced visualizations, including Treemaps, Scatter Charts, Histograms, Filled Map Charts, and Sparklines. Additionally, the course explores the Excel PivotChart feature and guides learners in assembling multiple visualizations into a cohesive dashboard. Participants also learn the importance of storytelling with data and how to build interactive dashboards using Excel and Cognos Analytics to communicate insights effectively. A significant portion of the course is dedicated to utilizing business intelligence (BI) tools like Cognos Analytics to create interactive dashboards.
Through a series of practical exercises and real-world scenarios, learners gain hands-on experience in crafting compelling visual narratives that drive informed decision-making. The module culminates in a final project where learners create a set of data visualizations and an interactive dashboard for their portfolio, which can be shared with peers, professional communities, or prospective employers. Participants are equipped with the skills to transform raw data into meaningful visualizations and dashboards that resonate with stakeholders. This helps participants gain an understanding of the pivotal role data visualizations play in communicating data analysis findings effectively.
Overall, Data Visualization and Dashboards with Excel and Cognos offer participants a comprehensive overview of data visualization techniques and tools. Whether you are a data analyst, business professional, or aspiring data visualization specialist, this course provides valuable insights and practical skills to elevate your data storytelling abilities and make a lasting impact with your data visualizations.
Course 4: Python for Data Science, AI & Development
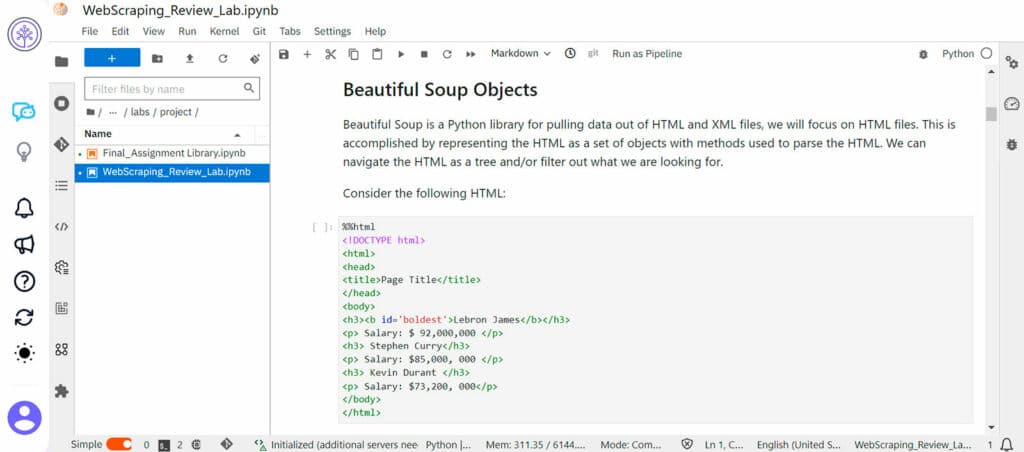
The fourth and intermediate-level course, “Python for Data Science, AI & Development,” introduces participants to the versatile programming language Python and its applications in data science, artificial intelligence, and software development. Over the course of twenty-six hours, learners explore Python programming fundamentals, including variables, data structures, branching, loops, functions, objects, and classes. The course covers advanced topics such as web scraping and data manipulation using libraries like Pandas and Numpy, as well as accessing and analyzing data using Jupyter Notebooks.
Through a series of hands-on coding exercises and projects, participants develop proficiency in using Python for data analysis and AI development. They learn how to apply Python programming logic to solve real-world problems, access and web scrape data from various sources, and develop code using Jupyter Notebooks for data analysis and visualization. By the end of the course, participants are equipped with the skills to leverage Python for data-driven decision-making and innovation, making it an invaluable tool in their data science toolkit.
Furthermore, the course provides valuable insights into web scraping techniques using Python, a skillset highly relevant in today’s data-driven landscape. By learning how to collect data from various online sources using APIs, learners enhance their ability to access and analyze diverse datasets for data-driven decision-making.
Course 5: Python Project for Data Science
The Python Project for Data Science course is a pivotal component of the IBM Data Analyst Professional Certificate program, providing learners with an opportunity to apply their foundational Python skills in a real-world data analysis project. This one-week course is a practical extension of the Python for Data Science, AI, and Development course, requiring learners to demonstrate their proficiency in Python and data manipulation techniques.
As participants step into the role of a data scientist, they engage in a multifaceted journey encompassing data collection, thorough cleaning, meticulous analysis, and insightful visualization. Armed with Python libraries like Pandas for data manipulation, Beautiful Soup for web scraping, and Plotly for interactive visualizations, learners construct dynamic dashboards that effectively convey their findings and insights.
Through this hands-on, project-based approach, participants not only demonstrate their mastery of Python programming and data analysis techniques but also cultivate invaluable problem-solving skills essential for success in data-driven roles. The iterative process of tackling diverse datasets and addressing real-world challenges fosters resilience and adaptability, crucial attributes in today’s dynamic data landscape. By completing this course, learners emerge with a robust portfolio of projects fortified with practical experience and the confidence to tackle a myriad of data challenges in professional settings.
Course 6: Databases and SQL for Data Science with Python
“Databases and SQL for Data Science with Python” empowers learners with indispensable skills in database management and SQL querying, fundamental pillars of data analysis. Participants embark on a comprehensive exploration, mastering the creation and manipulation of relational databases and adeptly working with multiple tables. Through hands-on practice, learners craft SQL queries to retrieve, analyze, and derive insights from vast datasets, utilizing techniques ranging from basic commands to advanced concepts like joins, views, and stored procedures.
This course serves as a gateway to unlocking the full potential of structured data analysis, equipping learners with the proficiency to extract valuable insights efficiently. Participants will develop a comprehensive understanding of SQL by learning how to write foundational SQL statements, manipulate result sets, and perform database operations such as creating, altering, and dropping tables. Through hands-on labs and projects, learners will gain practical experience in building SQL queries, accessing databases using Jupyter notebooks with SQL and Python, and working with real-world datasets. By delving into SQL for data science, participants enhance their analytical capabilities, enabling them to navigate complex datasets with ease. Moreover, mastering SQL opens doors to a plethora of career opportunities in data analysis, where the ability to harness the power of relational databases is highly sought after.
The culmination of the course involves analyzing multiple real-world datasets in a final project, allowing participants to demonstrate their proficiency in SQL and showcase their data analysis skills. This is an excellent opportunity for participants to apply their SQL skills to analyze real-world datasets, consolidating their learning and showcasing their proficiency to potential employers.
Course 7: Data Analysis with Python
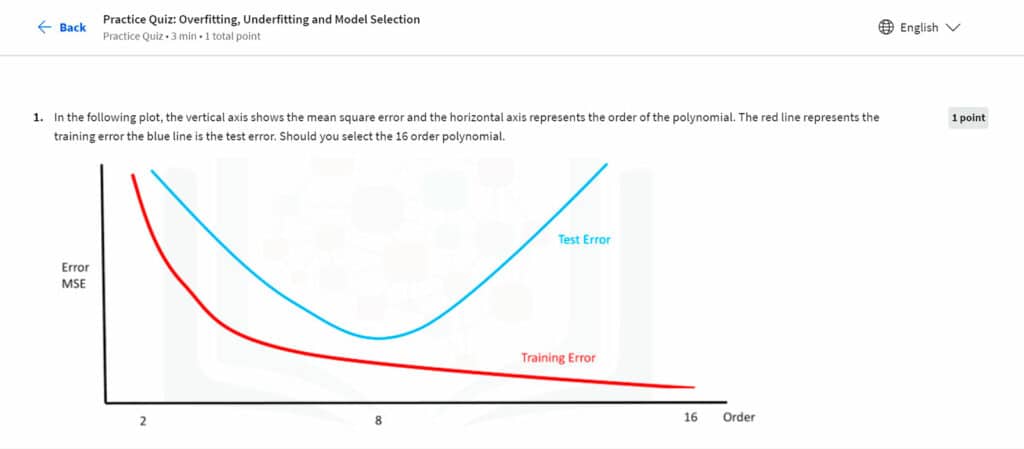
The “Data Analysis with Python” course in the IBM Data Analyst Professional Certificate program provides a comprehensive exploration of essential data analysis techniques using Python. Through a combination of video lectures, hands-on labs, and projects, participants learn data collection, cleaning, manipulation, and analysis. Topics include data frame manipulation, machine learning regression models, and data pipeline creation. Learners utilize Python libraries like Pandas, Numpy, scipy, and scikit-learn to work with real-world datasets and develop practical skills in data analysis. Successful completion awards a Coursera course certificate and IBM digital badge, validating proficiency in Python-based data analysis.
The “Data Analysis with Python” course is a valuable component of the IBM Data Analyst Professional Certificate program. It offers a structured approach to learning essential data analysis techniques with Python, catering to learners of all levels. The course’s hands-on approach, combined with clear instruction, facilitates the understanding and application of concepts. The inclusion of real-world projects enhances practical skills, making it a recommended choice for individuals seeking to excel in data analysis using Python. Additionally, the IBM digital badge provides tangible recognition of learners’ proficiency in Python-based data analysis, further enhancing the value of completing the course.
Course 8: Data Visualization with Python
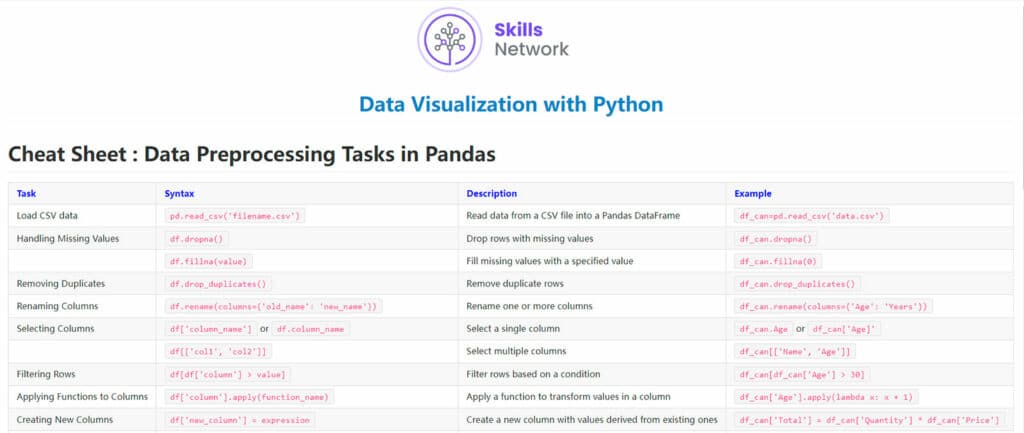
“Data Visualization with Python” equips learners with the tools and techniques to transform raw data into compelling visual narratives. Through an immersive exploration of Python libraries such as Matplotlib, Seaborn, and Plotly, participants learn to craft an array of visualizations, ranging from basic charts to interactive dashboards. By mastering the art of data visualization, learners enhance their ability to communicate insights effectively and engage stakeholders through compelling visual storytelling.
The course delves into the nuances of chart types, customization options, and best practices in dashboard design, providing learners with the skills to create visually stunning and informative visualizations. Through hands-on exercises and projects, participants gain practical experience in conveying complex data concepts in a visually appealing manner. The inclusion of interactive dashboards allows even those without prior data science experience to interpret and analyze data with ease, fostering a deeper understanding and informed decision-making. By mastering Python for data visualization, learners elevate the impact of their data analysis work, driving informed decision-making and organizational success.
This is a good course by itself or as a part of the professional certificate as well for individuals seeking to enhance their data analysis skills. With its focus on practical skills development and application, this course equips learners with the tools and knowledge needed to excel in data visualization and effectively convey insights to stakeholders.
Course 9: IBM Data Analyst Capstone Project
The “IBM Data Analyst Capstone Project” represents the pinnacle of learners’ journey, where they apply their acquired skills and knowledge to tackle a real-world data analysis challenge. As participants embark on this culminating endeavor, they demonstrate their proficiency in every aspect of the data analysis lifecycle, from data collection and wrangling to analysis and visualization. Guided by industry experts, learners navigate through the complexities of a data-driven project, showcasing their ability to deliver actionable insights that drive business value.
This capstone project serves as a testament to learners’ readiness to embark on successful careers in the high-growth field of data analytics. This project assesses participants’ ability to collect, wrangle, analyze, and visualize data, culminating in a comprehensive data analysis report presented to stakeholders. By completing this project, participants solidify their understanding of data analytics concepts and techniques, gaining invaluable hands-on experience that sets them apart in the competitive job market. Moreover, the capstone project provides learners with a tangible asset—a comprehensive portfolio of their work—that showcases their expertise and potential to prospective employers.
What do others say?
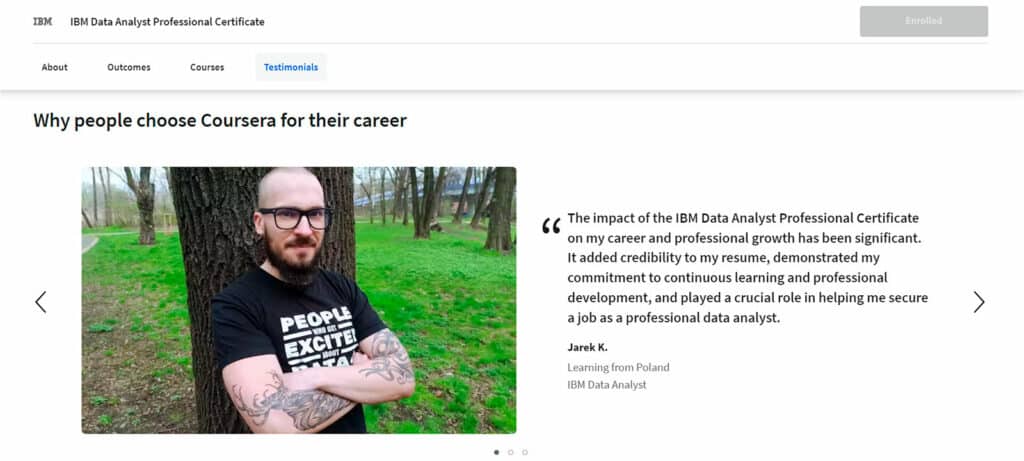
Feedback for the IBM Data Analyst Professional Certificate resonates with positivity across various platforms. Coursera users consistently laud the program for its comprehensive approach to imparting essential data analysis skills. Learners particularly appreciate the hands-on projects and practical exercises, which offer invaluable real-world experience in data manipulation, analysis, and visualization.
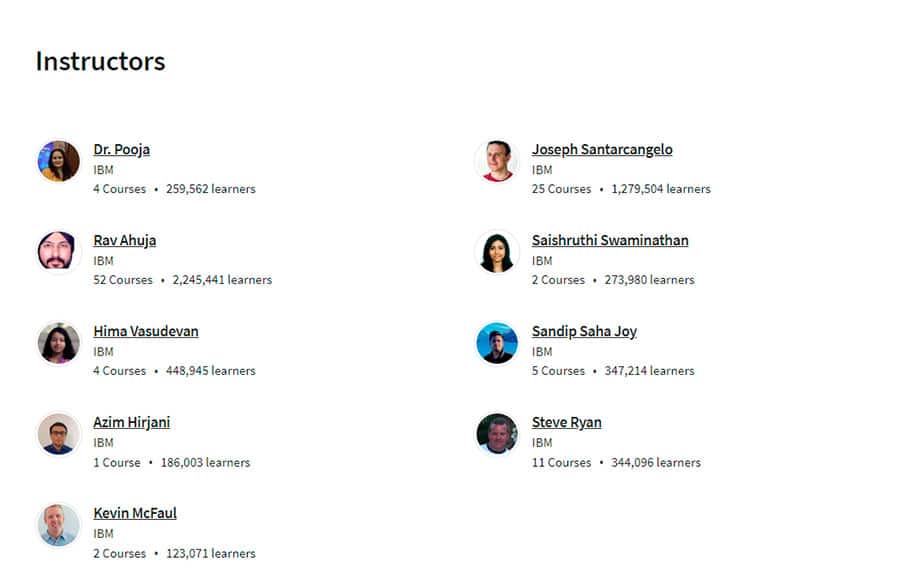
Many users on Quora commend the course instructors for their clear and engaging teaching style, noting their ability to simplify complex concepts effectively. Learners also value the program’s flexibility, enabling them to study at their own pace and seamlessly integrate learning into their existing schedules. Furthermore, individuals who have completed the certificate express satisfaction with the breadth of topics covered, spanning from Python and SQL to data visualization tools. They feel well-prepared to confront data analysis challenges in professional environments, owing to the practical knowledge acquired throughout the program.
Alternatives and complements to this certificate
For individuals seeking to broaden their data analysis skills beyond the IBM Data Analyst Professional Certificate, several alternatives and complementary resources are available.
- IBM Data Analytics with Excel and R Professional Certificate on Coursera: This program offers focused training specifically in Excel and R for comprehensive data analysis.
- IBM’s Data Science or Data Engineering Professional Certificates on Coursera: If your focus is primarily on Python and data science, or if you consider these prerequisites, exploring these professional certificates could be beneficial complements or alternatives for your career development.
- MicroMasters® Program from MIT in Statistics and Data Science and in Data Science from UC San Diego on edX: For more in-depth programs with an academic bent, these programs offered via edX provide more comprehensive skills, although they may be less targeted to real-world applications. The price point is also considerably higher, although much lower than a full in-person academic program.
- Further reading: Industry-specific books such as “Python for Data Analysis” and “Data Science for Business” provide further insights and can serve as a handy reference for those who prefer books in a more traditional format.
- Communities: Hands-on learning platforms like Kaggle offer opportunities to apply skills to real-world datasets.
These alternatives and complementary resources can augment your expertise in data analysis, enhancing the value of the IBM Data Analyst Professional Certificate.
Conclusion
The IBM Data Analyst Professional Certificate opens doors to a dynamic world of opportunities for individuals venturing into the realm of data analysis. By blending theoretical insights with hands-on experience, this program equips learners with indispensable skills in Python, SQL, data visualization, and beyond, laying a sturdy foundation for success in the ever-evolving field of data analytics.
Moreover, the recognition and endorsement from IBM add a significant dose of credibility to this certificate, making it a standout asset in the eyes of prospective employers. Whether you are a fresh graduate eager to dive into the workforce or a seasoned professional hungry for new challenges, the IBM Data Analyst Professional Certificate offers a solid launching pad for advancing your career in data analysis.
In essence, this certificate is a testament to your commitment to professional growth and your readiness to thrive in today’s data-driven business landscape. It speaks volumes about the caliber of the course, showcasing your newfound expertise and readiness to excel in the exciting world of data analysis.
Get 40% off your first year of Coursera Plus Annual — unlimited access to 10,000+ courses (new subscribers only)
Read Next

Originally published January 13, 2024